
Five Years ThatChanged AdelaideForever
Looking back at the run that reshaped South Australian property, and my honest view on where the market heads through the rest of 2026 and into 2027.
By Tony Lawson · Opinion

Five Years That Repriced South Australia
It is worth stopping for a moment and appreciating what has actually happened here. Five years ago Adelaide was the quiet cousin of the Australian property market. Affordable, stable, a bit overlooked. Today it is one of the most expensive capitals in the country relative to local incomes, and the median house has moved by an order most owners never expected to see in a single cycle.
I have sat at a lot of kitchen tables in that time. The conversation has changed. In 2021 people asked whether they should sell now or wait another year. By 2024 they were asking whether they had already missed the top. In 2026 the question I get most often is simply: is it over?
Adelaide Median House Value, 2021 to 2026
Indicative path of the Adelaide median house value across the five-year run, in thousands of dollars.
Indicative figures compiled from published CoreLogic and Domain median value reporting. Rounded for illustration.
My honest opinion is no, it is not over. But the engine has changed. What drove the last five years is not what will drive the next two.
Five-Year Value Growth by Capital City
Adelaide moved from the cheap seats to the front row. Indicative cumulative growth across the past five years.
Indicative comparison compiled from published capital city home value index reporting.
Adelaide did not get lucky. It got discovered, and then it got built.
Why It Happened, and Why It Matters Now
Four things stacked up at once. Cheap money made borrowing easy at the start of the run. Remote work made a well-priced capital with a twenty minute commute genuinely attractive. Migration returned hard after the border years and pushed both buyer and rental demand. And critically, South Australia simply did not build enough homes to meet it.
Three of those four have now faded or reversed. Money is not cheap. The remote work premium has largely been absorbed into prices. Migration has moderated from its peak. The fourth, the supply shortfall, is the one that has kept the floor under this market and it is the one now being actively addressed by the state.
That is the crux of my argument. The next chapter of the Adelaide market is a supply story and a policy story, not a demand story.
The T2D Effect Is Not Priced In Yet
The Torrens to Darlington project is the single largest infrastructure undertaking in this state's history. Ten and a half kilometres of tunnel and motorway, and roughly forty minutes off a peak run through the southern corridor. Our T2D land development report goes into the detail of the alignment, the spoil movement and the land supply that follows it.
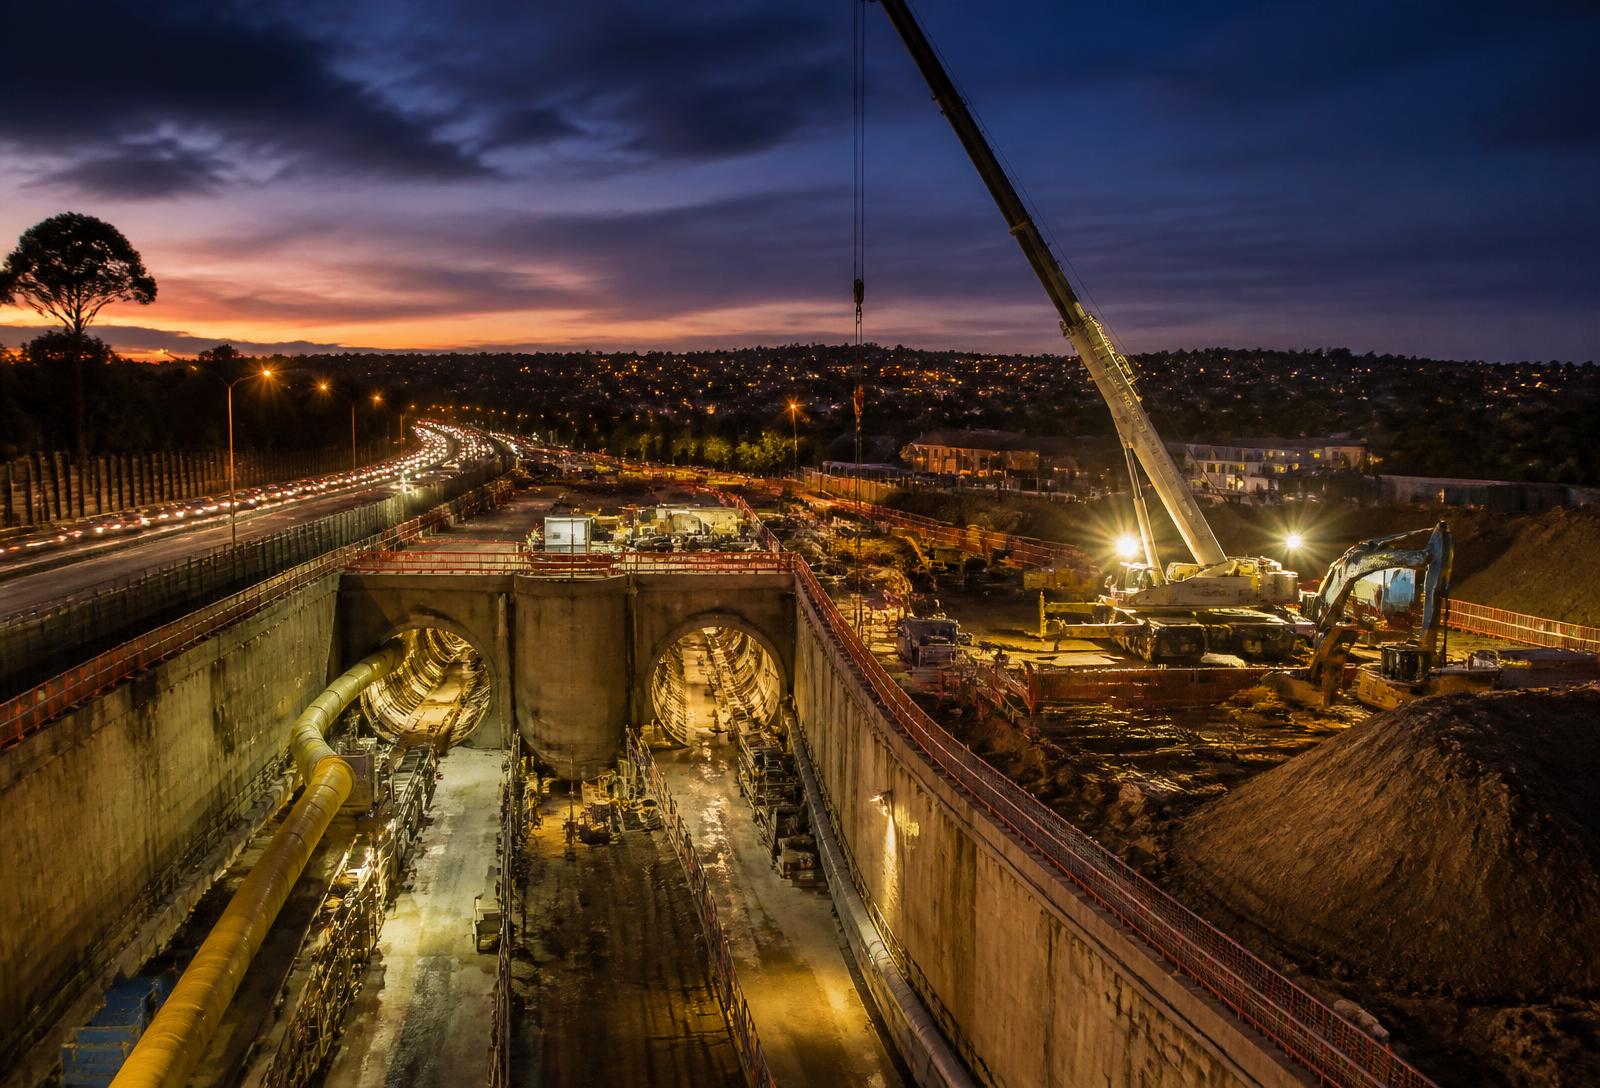
Here is my view on how that plays out. Infrastructure does not lift every suburb it touches. It lifts the suburbs that were previously penalised for being hard to reach. Along the T2D alignment there are pockets that have been priced as outer suburbs for thirty years despite sitting twelve kilometres from the CBD. Those are the addresses where the arithmetic changes permanently.
T2D Corridor Growth Premium
Suburbs along and either side of the Torrens to Darlington corridor have consistently outpaced the broader Adelaide average, and my expectation is that the gap holds while construction runs.
Indicative annual growth rates. Corridor figures based on suburb-level reporting across the T2D alignment; forward years are the author's opinion, not a forecast.
The construction years are messy. Noise, detours, acquisitions and disruption suppress sentiment on the streets closest to the works. That is exactly why I think the corridor premium is not fully priced. Buyers are discounting today's inconvenience rather than pricing tomorrow's access. That gap is an opportunity, and it does not stay open forever.
The Supply Timeline Is the Real Handbrake
The state's Housing Roadmap is the most consequential document in South Australian property right now, and almost nobody outside the industry has read it. Our timeline report tracks the major sites and the dates they become housing construction ready.
SA Housing Roadmap Pipeline by Readiness Year
Homes across the major state land releases tracked in our timeline report, grouped by the year each site becomes housing construction ready.
Source: Department for Housing and Urban Development (SA) project readiness dates, dhud.sa.gov.au. Figures subject to master planning.
Read that chart carefully, because the shape of it matters more than the total. There is a genuine slug of land coming online through 2026, then a thin year in 2027, then Concordia and Sellicks Beach land like a wave at the back end of the decade. Concordia alone is the largest single land release this state has seen.
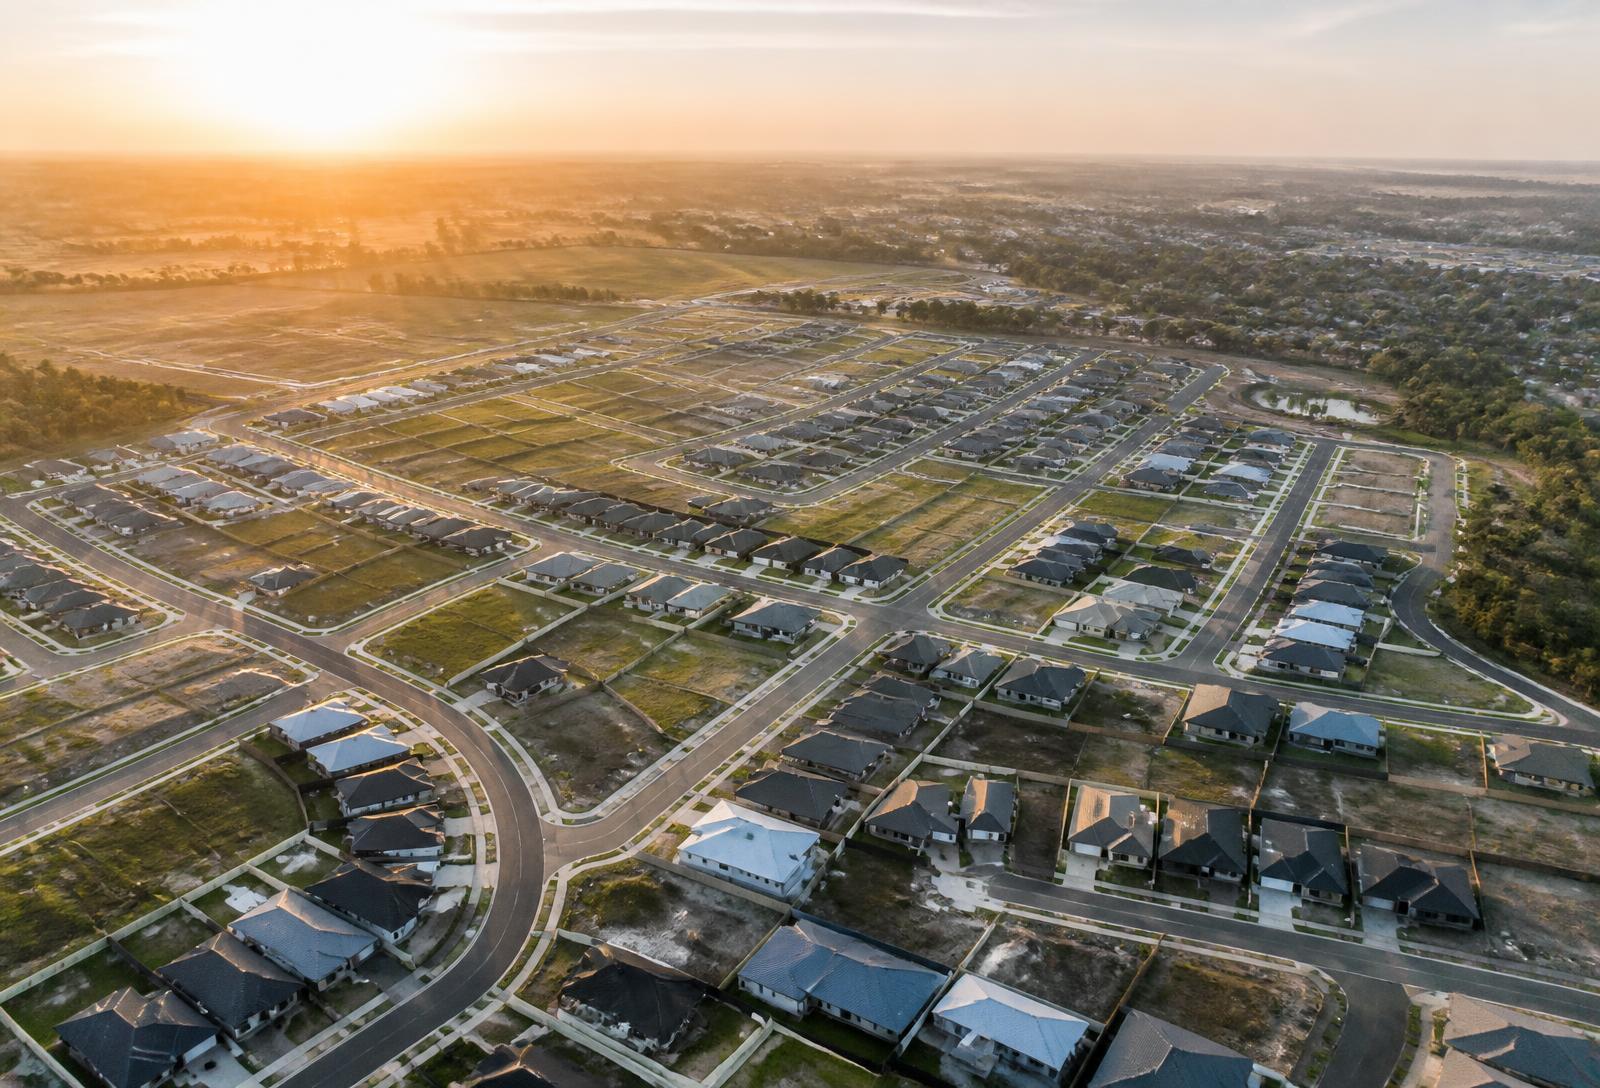
The trap is assuming that a released allotment is a finished home. It is not. Between a construction ready site and a family with keys sits titling, servicing, a builder with capacity and a trade base that is already stretched. My expectation is that the pipeline runs two to three years behind its headline dates in practice, which means the relief buyers are hoping for in 2027 mostly arrives in 2029 and 2030.
A shortage that is being fixed slowly is still a shortage.
The New Tax Rules Change Who Is Buying
The legislated replacement of the fifty per cent capital gains tax discount with inflation indexation and a minimum thirty per cent rate from 1 July 2028 is the biggest change to property tax settings in a generation. We break down the mechanics in the CGT reform explainer.
What the CGT Change Does to an Investor Sale
Illustrative tax payable on a $200,000 nominal gain, in thousands of dollars, under the old 50 per cent discount versus inflation indexation with a minimum 30 per cent rate.
Illustration only, based on the legislated replacement of the 50 per cent CGT discount with inflation indexation and a minimum 30 per cent rate from 1 July 2028. Not tax advice.
What that does in practice is punish nominal gains produced by inflation less generously and tax real gains more heavily at the top. For a high income investor holding a five year asset, the after tax outcome is materially worse than it was.
My read on the behaviour it produces over the rest of 2026 and through 2027 breaks into three groups. Investors sitting on large accrued gains have a window before the change and some of them will use it, which adds stock to the market in 2027 and early 2028. Investors buying now are underwriting on rental yield rather than capital growth, which favours the affordable end and regional South Australia where yields still work. And owner occupiers, who are entirely unaffected, quietly become a larger share of the buyer pool.
That last point is underrated. A market dominated by owner occupiers behaves differently. It transacts less often, holds through softness and competes hardest for good family homes in established suburbs. It produces fewer bargains and shallower corrections than an investor led market does.
Where I Think This Goes Through 2027
Putting it together: demand is cooler, supply is coming but late, infrastructure is repricing specific corridors, and the tax code is reshuffling who sits in the buyer pool. That is not the recipe for a crash and it is not the recipe for another 2022 either.
My Read on the Pace, 2026 into 2027
Annualised Adelaide growth. Gold bars are the author's opinion of where the pace settles, not a forecast or a valuation.
Author's opinion. Historic periods reflect published Adelaide home value index reporting; forward periods are commentary only.
I expect the rest of 2026 to look like what we are already seeing. Longer campaigns, more price adjustments, auction clearance rates well below last year, and a widening gap between properties that are presented and priced properly and those that are not. Averages will keep drifting up while individual sellers feel like the market is falling. Both things can be true at once.
Into 2027, I think three markets separate clearly. The infrastructure corridors keep outperforming. Affordable and regional stock holds up on yield as investors chase income rather than growth. And the premium end becomes genuinely lumpy, where a good result and a poor result on the same street can be hundreds of thousands apart depending on the campaign.
The risk to that view is honest and worth stating. If rates move higher again, or if the pre 2028 investor selling window turns into a rush rather than a trickle, the softness runs deeper and longer than I have described. I would rather say that plainly than pretend the range is narrower than it is.
What I Would Actually Do
If you are selling, stop waiting for the market of 2022 to return. It is not coming back in this cycle. The result you get now comes from presentation, pricing and reach, not from a rising tide. The sellers doing well in 2026 are the ones treating a campaign as a piece of work rather than a formality.
If you are buying, this is the most negotiating power buyers have had in five years, and it is concentrated in the corridors that are about to improve. Boring suburbs on the wrong side of a construction zone are where I would be looking.
If you are holding an investment, get advice on your position well before 1 July 2028 rather than in the months either side of it. Decisions made under a deadline are rarely the best ones.
The last five years rewarded anyone who simply owned property in Adelaide. The next two will reward the people who understand which part of Adelaide they own.
T2D Land Development Report
The corridor, the spoil map and the land supply behind the project.
The Timeline Report
Every major SA housing site and the year it becomes construction ready.
CGT Reform Explained
How indexation and the 30 per cent floor actually work.
Downsizing in a Buyer's Market
Why selling first can put downsizers in the box seat.
This article is opinion and general commentary only. It is not financial, taxation, legal or investment advice, and it is not a valuation or a forecast. Charts marked as indicative or as the author's opinion are illustrations of the argument rather than measured data. Individual circumstances differ and appropriate professional advice should be obtained before making property decisions.