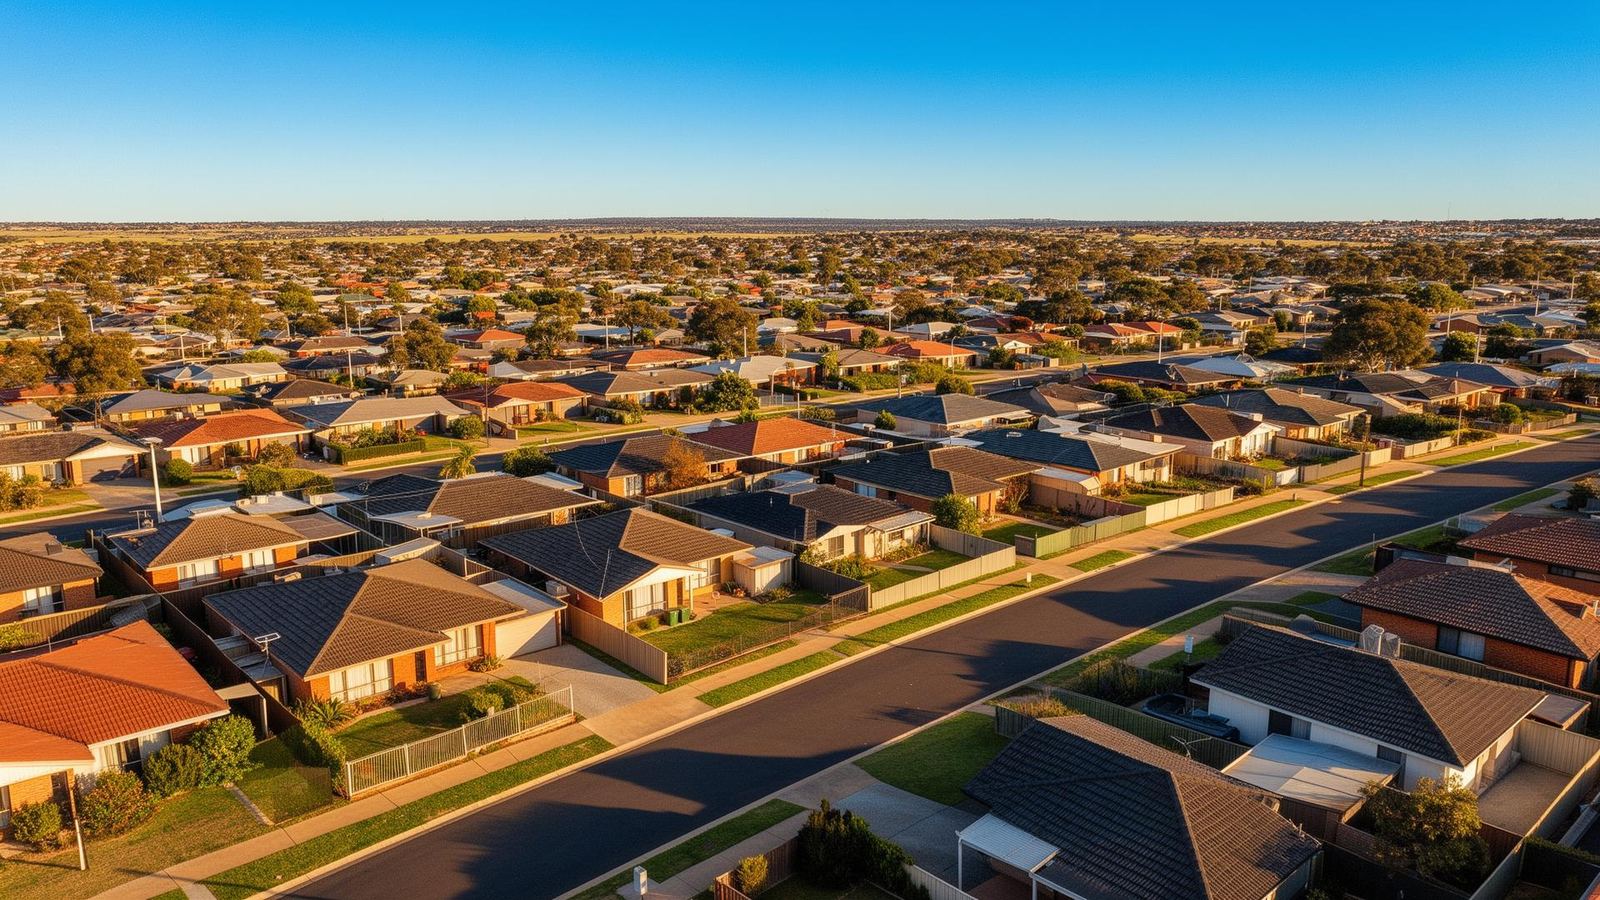
Elizabeth
Downs
Adelaide Northern Suburbs · SA 5113
House Median
$585K
+15.5%
Unit Median
$456K
+20.8%
Days on Market
32
Houses
Active Buyers
972
Total
Market Performance Score
A composite score measuring price growth, demand, liquidity, and rental performance.
At a Glance
Key market indicators for Elizabeth Downs, SA 5113 based on 12-month rolling data.
0
0
0 days
0
0%
0%
0%
$0/wk
Growth by Property Type
12-month price growth across different property configurations.
+23.6%
2 Bedroom Units have led growth across all segments this year.
+15.5%
Houses continue to deliver double-digit annual growth.
Total Sales Volume
193
Properties sold in 12 months
Price by Bedroom Count
Tap a card for expanded metrics including buyer-to-listing ratios.
All Houses
+15.5%$585,000
median sale price (12 months)
Buyers
970
Yield
4.3%
Rent
$490
Tap for more detail
2 Bed
+5.3%$400,000
median sale price (12 months)
Buyers
96
Yield
4.6%
Rent
$405
Tap for more detail
3 Bed
+15.8%$585,000
median sale price (12 months)
Buyers
861
Yield
4.2%
Rent
$490
Tap for more detail
4 Bed
+13.8%$660,000
median sale price (12 months)
Buyers
145
Yield
4.2%
Rent
$560
Tap for more detail
Median Price Trajectory
How Elizabeth Downs median prices have evolved from 2021 to 2025.
5-Year House Growth
+134%
$250K → $585K
5-Year Unit Growth
+128%
$200K → $456K
Avg. Annual Appreciation
~19%
Compounding over 5 years
How Does Elizabeth Downs Stack Up?
Comparing Elizabeth Downs house returns against alternative investments over the past 12 months.
Elizabeth Downs Houses
19.8%
ASX 200 (Avg)
12.7%
Adelaide Average
14.4%
Term Deposit
4.5%
Buyer Interest vs. Stock
Understanding the supply-demand dynamics driving Elizabeth Downs's market.
For Sale (Now)
24
houses
0
units
For Rent (Now)
31
houses
2
units
40:1
house buyer-to-listing ratio
For every house listed for sale, there are 40 active buyers searching. This represents a strong seller's market in Elizabeth Downs.
Live in Elizabeth Downs
A family-friendly northern suburb 30km from Adelaide CBD with strong community infrastructure.
Liveability Score
Key Amenities
Elizabeth City Centre
Elizabeth Downs Primary
Elizabeth Station
Pitman Park
Local Shops & Cafés
Lyell McEwin Hospital
35
Median Age
55%
Owner Occupied
45%
Renter Occupied
2.6
Avg Household Size
Surrounding Suburbs
How Elizabeth Downs compares to its neighbours.
Elizabeth North
$520K
+14.1%
Craigmore
$560K
+12.8%
Elizabeth Park
$510K
+16.3%
Smithfield
$590K
+13.5%
Andrews Farm
$540K
+11.9%
Davoren Park
$470K
+17.2%
Blakeview
$610K
+10.7%
Munno Para
$530K
+15.1%
About Elizabeth Downs
An affordable northern suburb with strong growth potential and family appeal.
Elizabeth Downs is a residential suburb in Adelaide's northern corridor, approximately 30km from the CBD. Part of the City of Playford, it offers affordable housing options that have attracted strong buyer interest in recent years, with median house prices reaching $585,000.
The suburb has experienced remarkable growth, with house prices up 15.5% and units surging 20.8% over the past 12 months. With 185 houses sold in the period and a rental yield of 4.3%, Elizabeth Downs offers investors an attractive combination of capital growth and income returns.
Elizabeth Downs benefits from proximity to the Elizabeth City Centre, the Lyell McEwin Hospital, and good transport links via the Gawler rail line. The suburb's affordability relative to inner-city Adelaide, combined with ongoing infrastructure investment in the northern corridor, positions it as a compelling opportunity for both first-home buyers and investors.
SA Stamp Duty
Calculator
Know exactly what you'll pay. Enter a purchase price to instantly calculate stamp duty for South Australia.
Stamp Duty Payable
$26,005
% of Price
4.45%
Total Cost
$611,005
What's Your
Property Worth?
Get a comprehensive, data-driven valuation report for your property — completely free. Our reports combine recent comparable sales, suburb trends, and local market intelligence.
Comparable sales analysis from the past 12 months
Suburb growth trends and price trajectory
Personalised PDF report delivered to your inbox
Enter your property address
We'll prepare a detailed market report for you.
No obligation. Takes less than 60 seconds.
The Forces Reshaping
Adelaide's Property Market
Population surges, infrastructure mega-projects, and constrained supply are converging to reshape Adelaide's property landscape. Understand the macro forces driving prices across the city.
Annual Growth
+13.7%
Adelaide Median
Population Growth
+2.1%
SA Annual
Supply
-28%
Listings YoY
Days on Market
29
Metro Average

Thinking About Elizabeth Downs?
Whether you're buying, selling, or investing in Elizabeth Downs, I can provide a personalised strategy backed by deep local knowledge and current market data.
Data sourced from realestate.com.au, Jan 2025 – Jan 2026. RLA 308543